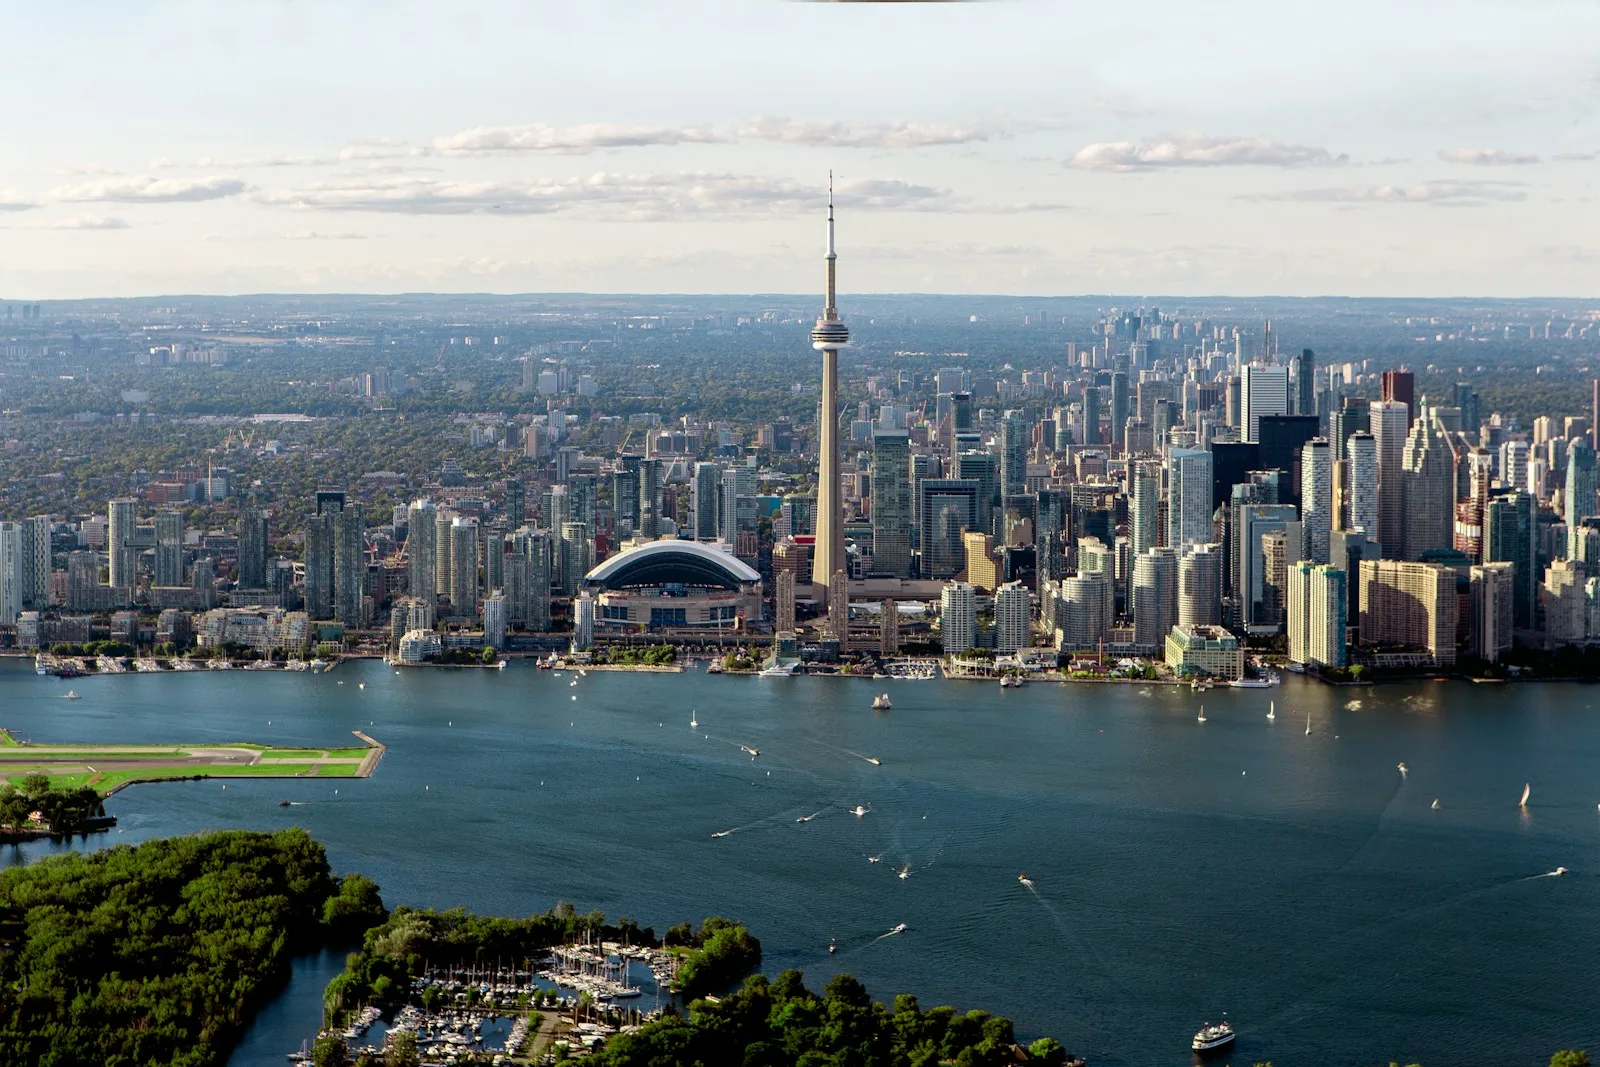
Toronto recorded 262 shootings across its 158 neighbourhoods in 2025, 43% fewer than the 461 recorded in 2024 and the lowest annual total since 2014, according to Toronto Police Service open data (our calculation). The city-wide rate was 8.2 shootings per 100,000 residents, and 54 of 158 neighbourhoods recorded no shootings at all in 2025.
Data: Toronto Police Service, Neighbourhood Crime Rates Open Data (shootings 2014–2025, last updated 2 February 2026), with 2025 population estimates; Toronto Police Service glossary; Statistics Canada, “Firearms and violent crime in Canada, 2024” (released 21 April 2026). Totals, rates, shares and rankings are our own calculation. Updated 14 November 2026.
Key facts
- Toronto had 262 shootings in 2025, down from 461 in 2024 (−43%), in Toronto Police Service neighbourhood data (our calculation).
- The 2025 total was the lowest since 2014 (177) and 47% below the 2019 peak of 492.
- The city-wide shooting rate was 8.2 per 100,000 residents in 2025 (our calculation, population 3,214,722).
- 54 of 158 neighbourhoods, home to about 1.02 million people, recorded zero shootings in 2025.
- 81 neighbourhoods had fewer shootings in 2025 than in 2024; 36 had more and 41 were unchanged.
- Lawrence Park South was the only Toronto neighbourhood with no recorded shooting in any year from 2014 to 2025.
How many shootings were there in Toronto in 2025?
Toronto Police Service data show 262 shootings in the city’s 158 neighbourhoods in 2025, or about five a week on average (our arithmetic). That was the first year since 2014 with fewer than 288 shootings.
A shooting, in Toronto Police data, is an incident in which a victim was shot or shot at with a real firearm, or where there is evidence that a bullet was discharged from a real firearm. The count excludes suicides, police-involved shootings and incidents where the weapon was not a real firearm, according to the Toronto Police glossary. A shooting does not mean someone was injured.
| Year | Shootings in Toronto (count) | Change vs previous year |
|---|---|---|
| 2014 | 177 | — |
| 2015 | 288 | +63% |
| 2016 | 407 | +41% |
| 2017 | 392 | −4% |
| 2018 | 427 | +9% |
| 2019 | 492 | +15% |
| 2020 | 461 | −6% |
| 2021 | 408 | −11% |
| 2022 | 380 | −7% |
| 2023 | 343 | −10% |
| 2024 | 461 | +34% |
| 2025 | 262 | −43% |
Sum of all 158 neighbourhoods, Toronto Police Service Neighbourhood Crime Rates Open Data; changes are our calculation. Contains information licensed under the Open Government Licence – Ontario.
The 2025 drop reversed the 2024 jump. Shootings fell four years in a row from 2019 to 2023, rose by more than a third in 2024 and then fell to a 12-year low. Neighbourhood totals can differ slightly from Toronto Police city-wide reports, because a few incidents cannot be placed in a neighbourhood.
Are shootings going down in Toronto?
Yes: shootings in Toronto fell 43% in 2025, from 461 to 262, and 81 of the city’s 158 neighbourhoods recorded fewer shootings than in 2024 (our calculation from Toronto Police Service data). The 2025 total was also 47% below the 2019 peak.
The decline matches the national picture. Statistics Canada reported that police-recorded incidents of using, discharging or pointing a firearm fell 14% across Canada in 2025, and homicides committed with a handgun fell 31%. For the national data and the Toronto metro area’s 2024 firearm crime rate, see gun crime in Canada; for killings by year, see Toronto homicides by year.
Which Toronto neighbourhoods had no shootings in 2025?
54 of Toronto’s 158 neighbourhoods recorded no shootings in 2025, and together they are home to about 1.02 million people, close to a third of the city’s population (our calculation from Toronto Police Service data). The largest of them by population are listed below.
| Neighbourhood | Shootings (2025) | Shootings (2024) | Population (2025) |
|---|---|---|---|
| Don Valley Village | 0 | 0 | 31,066 |
| Church-Wellesley | 0 | 0 | 30,048 |
| Bayview Village | 0 | 3 | 30,037 |
| South Eglinton-Davisville | 0 | 2 | 28,902 |
| Westminster-Branson | 0 | 2 | 28,693 |
| Malvern East | 0 | 5 | 28,466 |
| Newtonbrook West | 0 | 1 | 26,457 |
| Birchcliffe-Cliffside | 0 | 1 | 25,904 |
| Fort York-Liberty Village | 0 | 5 | 25,723 |
| Steeles | 0 | 0 | 25,699 |
Our calculation from Toronto Police Service Neighbourhood Crime Rates Open Data (Open Government Licence – Ontario). Population figures are the estimates published in the same dataset.
Seven neighbourhoods recorded no shootings in any of the last three years (2023–2025): Lawrence Park North, Lawrence Park South, Mount Pleasant East, Yonge-St.Clair, Bedford Park-Nortown, Bayview Woods-Steeles and Kingsway South. For a ranking across five major crimes, see the safest neighbourhoods in Toronto.
Which neighbourhoods saw the biggest drop in shootings?
Beechborough-Greenbrook had the largest percentage drop in shootings among Toronto neighbourhoods with at least 8 shootings in 2024, from 13 to 1 (−92%), according to our calculation from Toronto Police Service data. All 16 neighbourhoods with 8 or more shootings in 2024 recorded fewer in 2025.
- Beechborough-Greenbrook: 13 to 1 (−92%)
- Humber Heights-Westmount: 8 to 1 (−88%)
- Mount Dennis: 9 to 2 (−78%)
- Oakridge: 8 to 2 (−75%)
- York University Heights: 11 to 4 (−64%)
- Mount Olive-Silverstone-Jamestown: 19 to 7 (−63%)
Small numbers swing sharply from year to year, so one year’s change in a single neighbourhood is not a trend. Looking at several years gives a fairer picture.
Where were shootings most common in Toronto in 2025?
Wexford/Maryvale and West Humber-Clairville each recorded 10 shootings in 2025, the highest counts of any Toronto neighbourhood, followed by Glenfield-Jane Heights and Black Creek with 8 each, according to Toronto Police Service data. No neighbourhood recorded more than 10 shootings in 2025, compared with a maximum of 19 in 2024.
The 10 neighbourhoods with the most shootings accounted for about 27% of the city total in 2025, close to the 29% share in 2024 (our calculation). In other words, shootings remain spread across many parts of the city rather than confined to a few areas, and 90 of 158 neighbourhoods had a rate below the city-wide 8.2 per 100,000. The neighbourhood data do not say who was involved, and most residents of every neighbourhood are never affected by gun violence.
How can I check shootings near my address in Toronto?
- Find your neighbourhood among the City of Toronto’s 158 neighbourhoods.
- Open the official data. The Toronto Police shootings dashboard and the Public Safety Data Portal show shootings by year and area.
- Compare rates, not raw counts, with the city-wide 8.2 shootings per 100,000 residents.
- Look at several years, because neighbourhoods with one or two shootings can swing sharply.
- Use our guides: the Toronto crime map, Toronto crime rate by neighbourhood and Toronto break-ins by neighbourhood.
Want this on your phone?
Safety App puts official crime data on a live map, plans walking routes that avoid high-risk areas and sends one-tap SOS alerts to the people you trust. Now on Google Play for Android; iPhone coming soon.
Toronto shootings FAQ
How many shootings were there in Toronto in 2025?
Toronto Police recorded 262 shootings across the city’s 158 neighbourhoods in 2025, down 43% from 461 in 2024 (our calculation from open data).
Are shootings in Toronto going down?
Yes. The 2025 total of 262 was the lowest since 2014 and 47% below the 2019 peak of 492 shootings.
What is the shooting rate in Toronto?
The city-wide rate was 8.2 shootings per 100,000 residents in 2025, based on Toronto Police neighbourhood data and 2025 population estimates (our calculation).
Which Toronto neighbourhoods have the fewest shootings?
54 neighbourhoods recorded no shootings in 2025, and Lawrence Park South recorded none in any year from 2014 to 2025.
Does a shooting mean someone was hurt?
No. Toronto Police count any incident where a real firearm was fired at someone or a bullet was discharged, whether or not anyone was injured.
Related: Is Toronto safe? · Is Scarborough safe? · Toronto car theft by neighbourhood · safest cities in Ontario · Canada Crime Map. In an emergency call 911.





