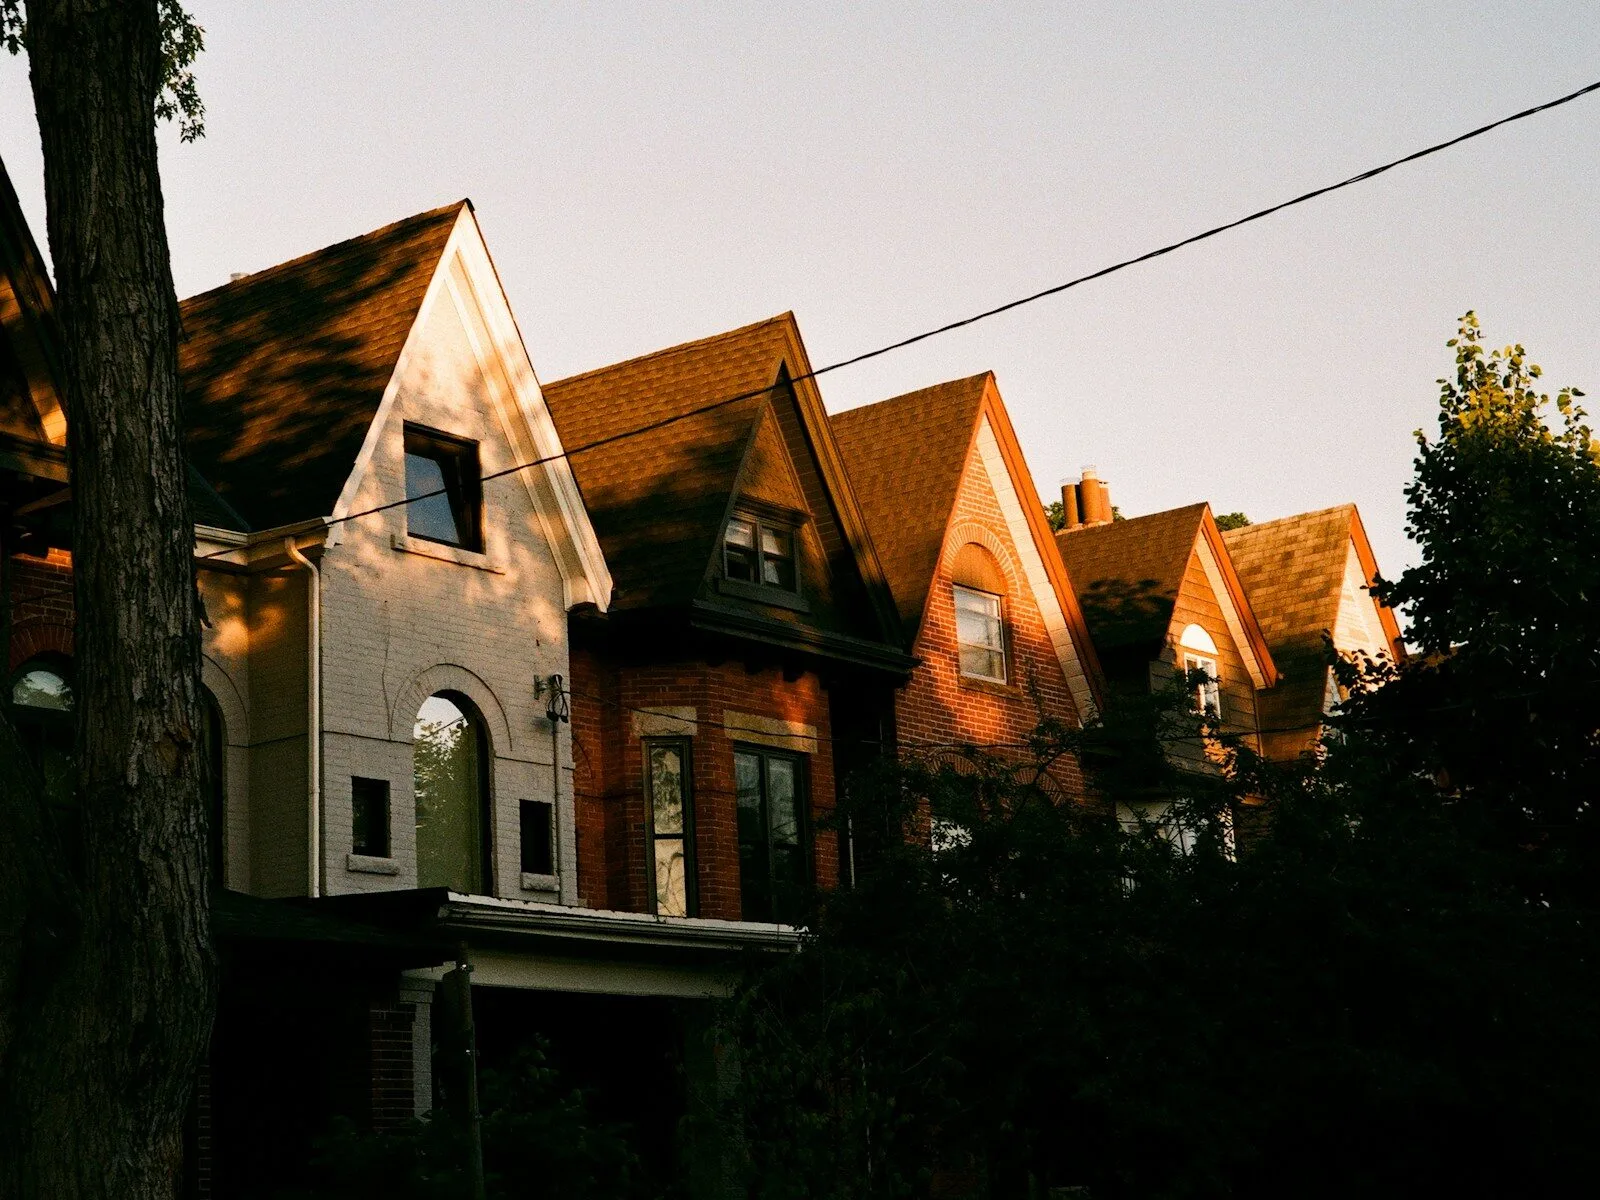
Toronto Police recorded 6,092 break and enters across the city’s 158 neighbourhoods in 2025, a rate of 190 per 100,000 residents and 11% fewer than in 2024. That is 28% below the 2019 high of 8,438, according to Toronto Police Service open data (our calculation). 100 of 158 neighbourhoods recorded fewer break-ins than a year earlier.
Data: Toronto Police Service, Neighbourhood Crime Rates Open Data (2014–2025, last updated 2 February 2026), with population estimates by Environics Analytics; Statistics Canada, police-reported crime statistics for 2025 (released 22 July 2026). Totals, rates, shares and rankings are our own calculation. Updated 12 October 2026.
Key facts
- Toronto recorded 6,092 break and enters in 2025, down from 6,824 in 2024 (−11%), in Toronto Police Service neighbourhood data (our calculation).
- The city-wide break-in rate was 190 per 100,000 residents in 2025 (our calculation, population 3,214,722).
- 100 of 158 neighbourhoods recorded fewer break-ins in 2025 than in 2024; 47 recorded more and 11 were unchanged.
- Lambton Baby Point had Toronto’s lowest break-in rate in 2025: 3 break-ins, or 35 per 100,000 residents.
- The 2025 total was 15% below 2014 (7,184) and the third-lowest in the 2014–2025 series, after 2021 (5,670) and 2022 (6,043).
- The Toronto census metropolitan area (CMA) had a break and enter rate of 169 per 100,000 in 2025, below the national 262 (Statistics Canada, released 22 July 2026).
How many break-ins are there in Toronto?
Toronto Police Service data show 6,092 break and enters in the city of Toronto in 2025, or about 17 a day on average (our arithmetic). The total fell for the second year in a row after a rise in 2022 and 2023.
Break and enter is the Criminal Code offence of entering a home, business or other building without permission with intent to commit a crime, such as theft. The Toronto Police neighbourhood counts do not separate homes from businesses, and they exclude reports deemed unfounded.
| Year | Break and enters in Toronto (count) | Change vs previous year |
|---|---|---|
| 2014 | 7,184 | — |
| 2016 | 6,402 | — |
| 2018 | 7,565 | — |
| 2019 | 8,438 | +12% |
| 2020 | 6,914 | −18% |
| 2021 | 5,670 | −18% |
| 2022 | 6,043 | +7% |
| 2023 | 7,634 | +26% |
| 2024 | 6,824 | −11% |
| 2025 | 6,092 | −11% |
Sum of all 158 neighbourhoods, Toronto Police Service Neighbourhood Crime Rates Open Data; changes are our calculation. Contains information licensed under the Open Government Licence – Ontario.
Break-ins have fallen more steadily than car theft in Toronto: the 2025 break-in total was below 2014, while auto theft was still about double its 2014 level. See Toronto car theft by neighbourhood for that trend.
Which Toronto neighbourhoods have the fewest break-ins?
Lambton Baby Point had the lowest break and enter rate of Toronto’s 158 neighbourhoods in 2025, at 35 per 100,000 residents, followed by Malvern West at 44 and Henry Farm at 55 (our calculation from Toronto Police Service data). The ten lowest rates were spread across Scarborough, North York, Etobicoke, York and East York.
| Rank | Neighbourhood | Break-ins (2025) | Break-ins (2024) | Rate per 100,000 (2025) |
|---|---|---|---|---|
| 1 | Lambton Baby Point | 3 | 15 | 35 |
| 2 | Malvern West | 8 | 17 | 44 |
| 3 | Henry Farm | 14 | 19 | 55 |
| 4 | Mount Olive-Silverstone-Jamestown | 19 | 29 | 55 |
| 5 | Guildwood | 6 | 15 | 56 |
| 6 | Yonge-Doris | 14 | 18 | 58 |
| 7 | Westminster-Branson | 17 | 18 | 59 |
| 8 | Flemingdon Park | 16 | 19 | 61 |
| 9 | Woodbine-Lumsden | 6 | 11 | 70 |
| 10 | West Rouge | 17 | 21 | 75 |
| — | Toronto, all 158 neighbourhoods | 6,092 | 6,824 | 190 |
Our calculation from Toronto Police Service Neighbourhood Crime Rates Open Data (Open Government Licence – Ontario). Rates use 2025 population estimates; neighbourhoods with small populations can swing sharply from year to year.
91 of the 158 neighbourhoods had a break-in rate below the city-wide 190 per 100,000 (our calculation). For a ranking across five major crimes, see the safest neighbourhoods in Toronto.
Where do the most break-ins happen in Toronto?
The Annex recorded the most break and enters of any Toronto neighbourhood in 2025, with 149, followed by West Humber-Clairville (130), York University Heights (126), Wellington Place (111) and Rosedale-Moore Park (105), according to Toronto Police Service data. Together, the 10 neighbourhoods with the most break-ins accounted for about 18% of the city total (our calculation).
Break-ins are more spread out across the city than car theft, where the 10 highest-count neighbourhoods accounted for about 24% of thefts. Because the counts include businesses, neighbourhoods with many shops, offices and restaurants can record more break-ins than their resident population suggests.
Which neighbourhoods saw the biggest drop in break-ins?
Greenwood-Coxwell cut break-ins by 53% from 2024 to 2025, the largest percentage drop among neighbourhoods with at least 40 break-ins in 2024 (our calculation from Toronto Police Service data).
- Greenwood-Coxwell: 45 to 21 (−53%)
- Playter Estates-Danforth: 41 to 20 (−51%)
- Oakwood Village: 47 to 25 (−47%)
- Thorncliffe Park: 47 to 25 (−47%)
- Roncesvalles: 71 to 42 (−41%)
The largest drop in absolute numbers was in Kensington-Chinatown, from 152 to 101 break-ins. Across the city, 119 of 158 neighbourhoods were below their 2019 level in 2025 (our calculation).
How does Toronto compare with the rest of Canada for break-ins?
The Toronto census metropolitan area had a break and enter rate of 169 per 100,000 people in 2025, down from 184 in 2024 and well below the national rate of 262, according to Statistics Canada. Ontario’s provincial rate was 189, the lowest of the 10 provinces. Break-ins fell 11% nationally in 2025 and declined in every province and territory.
The Statistics Canada figure covers the whole metro area, including Mississauga, Brampton and much of York Region, so it is not directly comparable with the Toronto Police city count. Our break-ins in Canada report ranks every metro area, and the Ontario crime map lists police maps across the province.
How can I check break-ins near my address in Toronto?
- Find your neighbourhood among the City of Toronto’s 158 neighbourhoods.
- Open the official data. The Toronto Police Public Safety Data Portal maps break and enters and offers downloadable data.
- Compare rates with the city-wide 190 per 100,000, not raw counts.
- Look at several years, because small neighbourhoods can swing sharply.
- Use our guides: the Toronto crime map and home security tips for Canada.
Want this on your phone?
Safety App Canada puts official crime data on a live map, plans walking routes that avoid high-risk areas and sends one-tap SOS alerts to the people you trust. Coming soon to Android and iPhone.
Toronto break-ins FAQ
Are break-ins going down in Toronto?
Yes. Toronto Police recorded 6,092 break and enters in 2025, down 11% from 6,824 in 2024 and 28% below the 2019 high of 8,438.
What is the break-in rate in Toronto?
The city-wide break and enter rate was 190 per 100,000 residents in 2025, based on Toronto Police neighbourhood data (our calculation).
Which Toronto neighbourhood has the fewest break-ins?
Lambton Baby Point had the lowest break-in rate in 2025, with 3 break-ins, or 35 per 100,000 residents, followed by Malvern West at 44.
Do the Toronto break-in numbers include businesses?
Yes. The Toronto Police neighbourhood counts do not separate homes from businesses, so busy commercial areas can show higher counts.
Is Toronto bad for break-ins compared with other cities?
No. The Toronto metro area’s 2025 break-in rate of 169 per 100,000 was about 35% below the national rate of 262 (our calculation from Statistics Canada data).
Related: Is Toronto safe? · Toronto crime rate by neighbourhood · safest places to live in the GTA · safest cities in Ontario · crime rate in Canada by city · Canada Crime Map · Toronto bike theft by neighbourhood. In an emergency call 911.